Quickly analyze and graph data
Import your data instantly generate these graphs
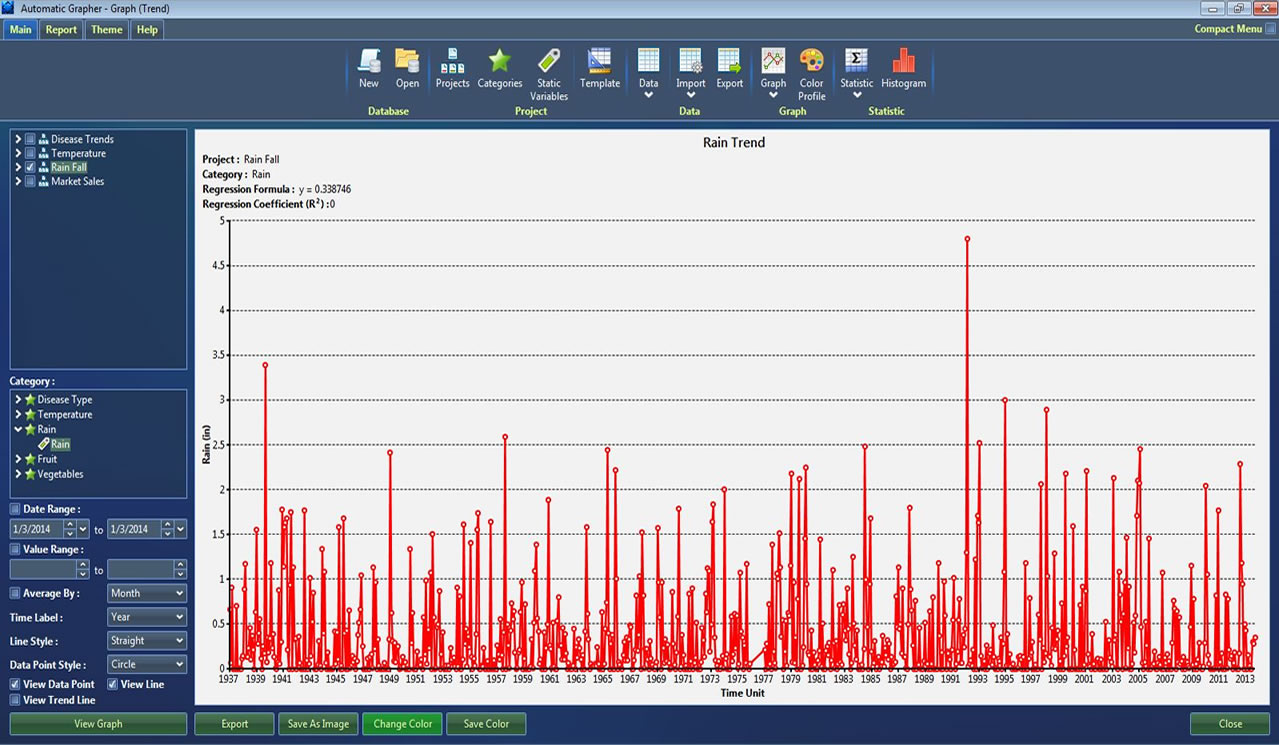
Trend Graph
- Plot data over time.
- Modify date ranges.
- Add trend line.
- Calculate regression formula and coefficient.
- Average data by day, month, or year.
- Fully customizable color options.
- Change line and data point styles.
- Export plot for presentations and reports.
- Export data and graphs into an Excel file.
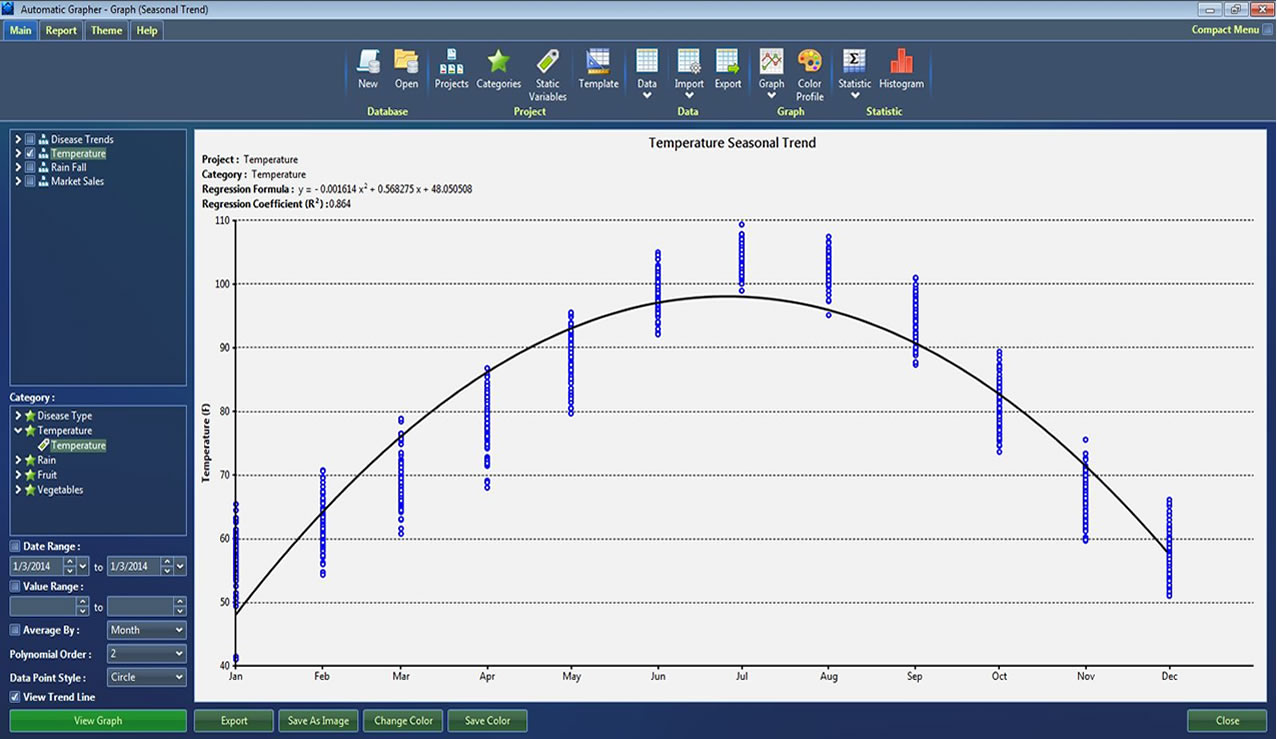
Seasonal Trend
- Plot data by the month to Identify seasonal trends.
- Monitor an item over the year.
- Average data by date, month or year.
- Change the degree of polynomial to fit data.
- Change colors of lines.
- Customize each axis.
- Export plot for presentations and reports.
- Export data and graphs into an Excel file.
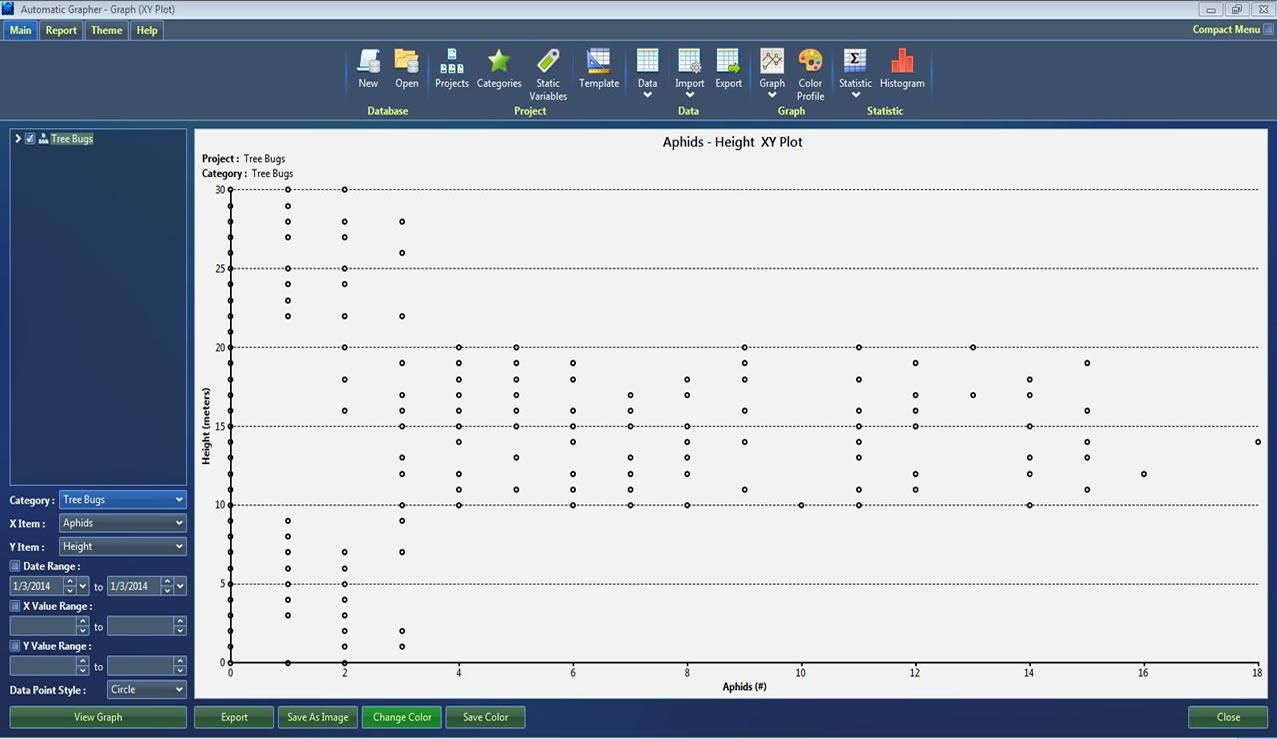
XY Plot
- Plot any X and Y variable.
- Average data by date, month or year.
- Easily change variables.
- Modify date ranges.
- Fully customizable color options.
- Change data point styles.
- Export plot for presentations and reports.
- Export data and graphs into an Excel file.
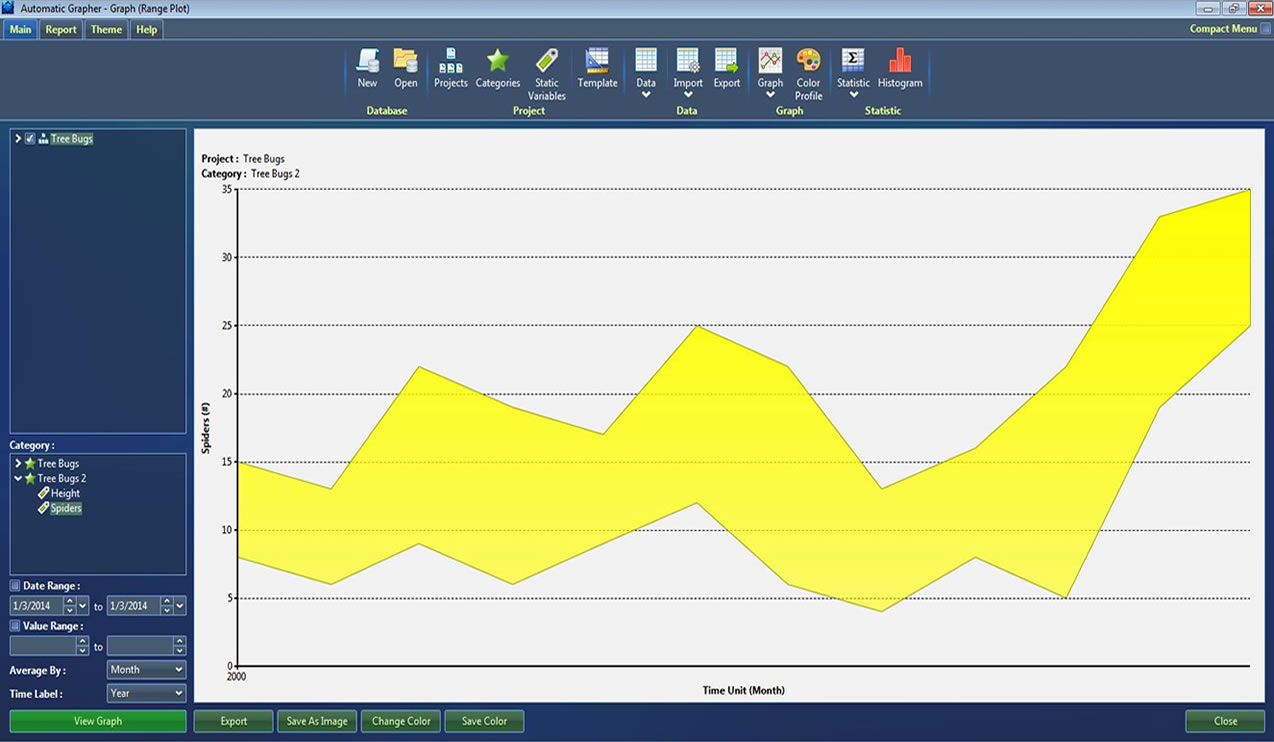
Range Plot
- Quickly graph maximum and minimum values over time.
- Modify date ranges.
- Change scales.
- Average data by date, month or year.
- Fully customizable color options.
- Export plot for presentations and reports.
- Export data and graphs into an Excel file.
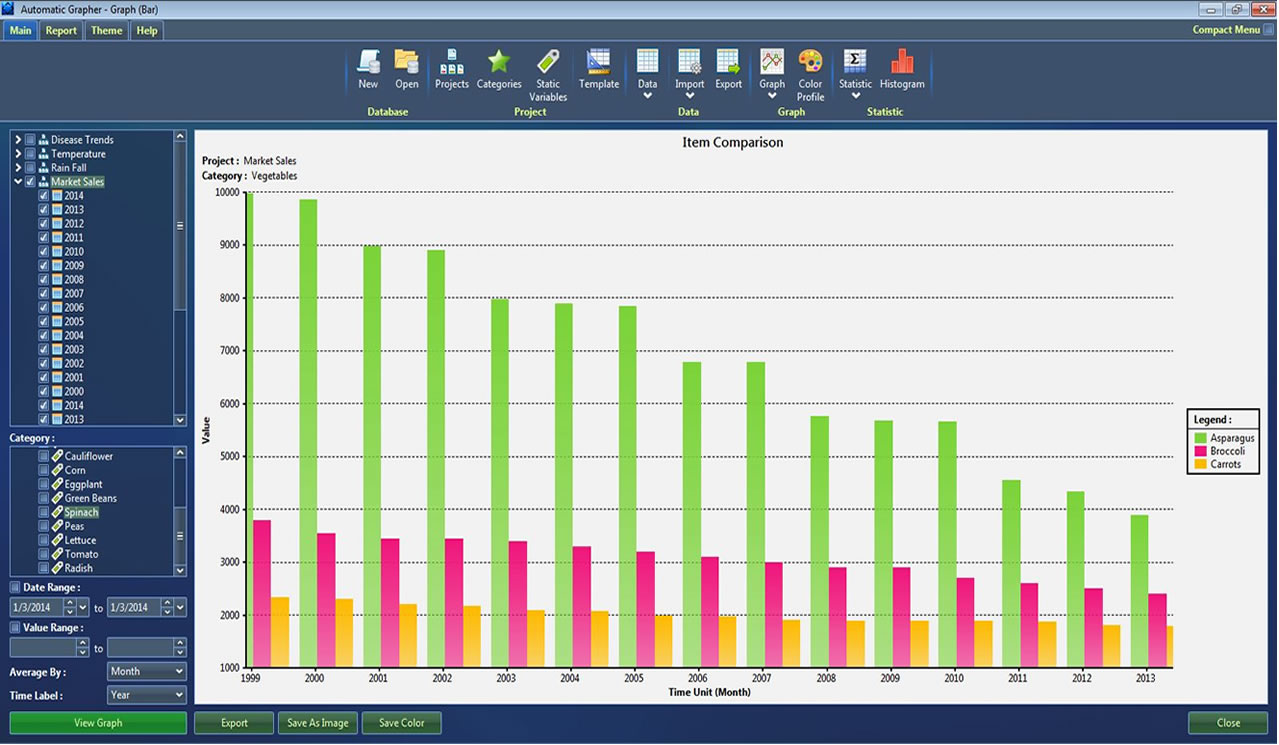
Bar Chart
- Compare data from one location over time.
- Compare several items together.
- Change scales.
- Average data by date, month or year.
- Fully customizable color options.
- Export plot for presentations and reports.
- Export data and graphs into an Excel file.
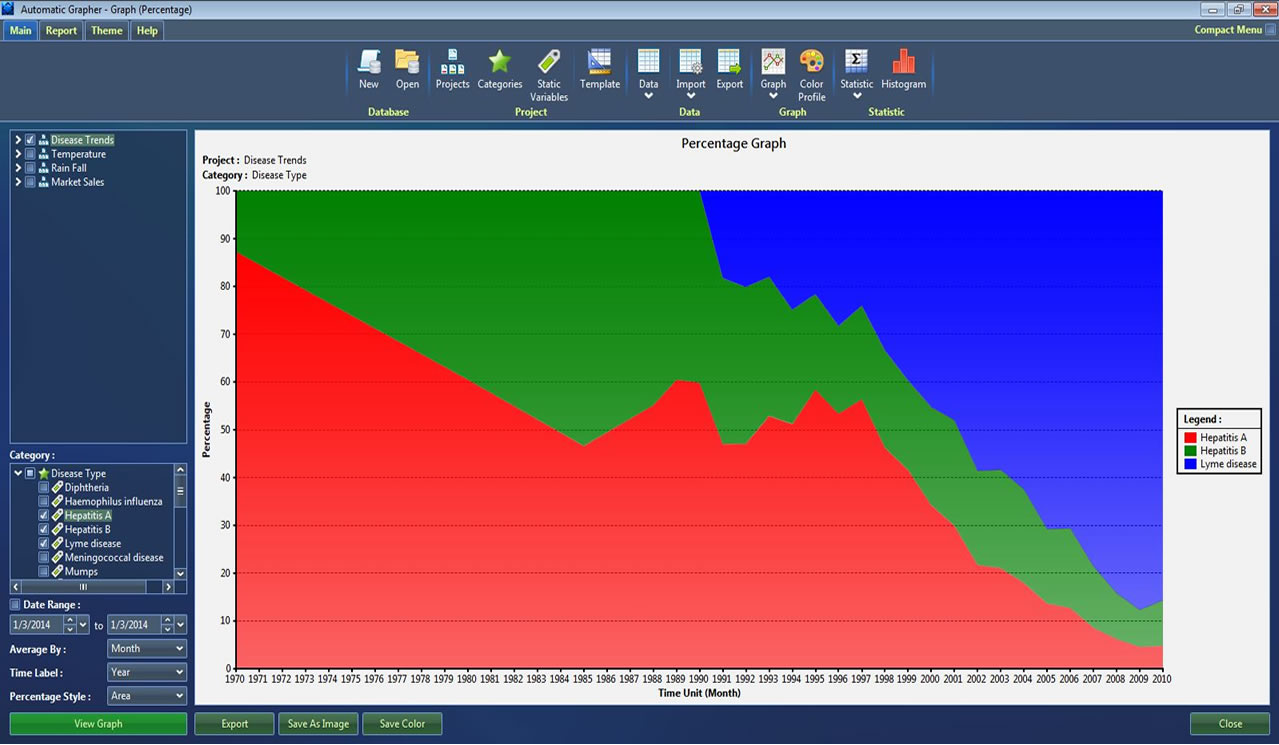
Percentage Graph
- Monitor percentages of a sample.
- Graph averages by month, day and year.
- Easily add new items to add to graph.
- Graph using 2 styles of graph.
- Average data by date, month or year.
- Fully customizable color options.
- Export plot for presentations and reports.
- Export data and graphs into an Excel file.
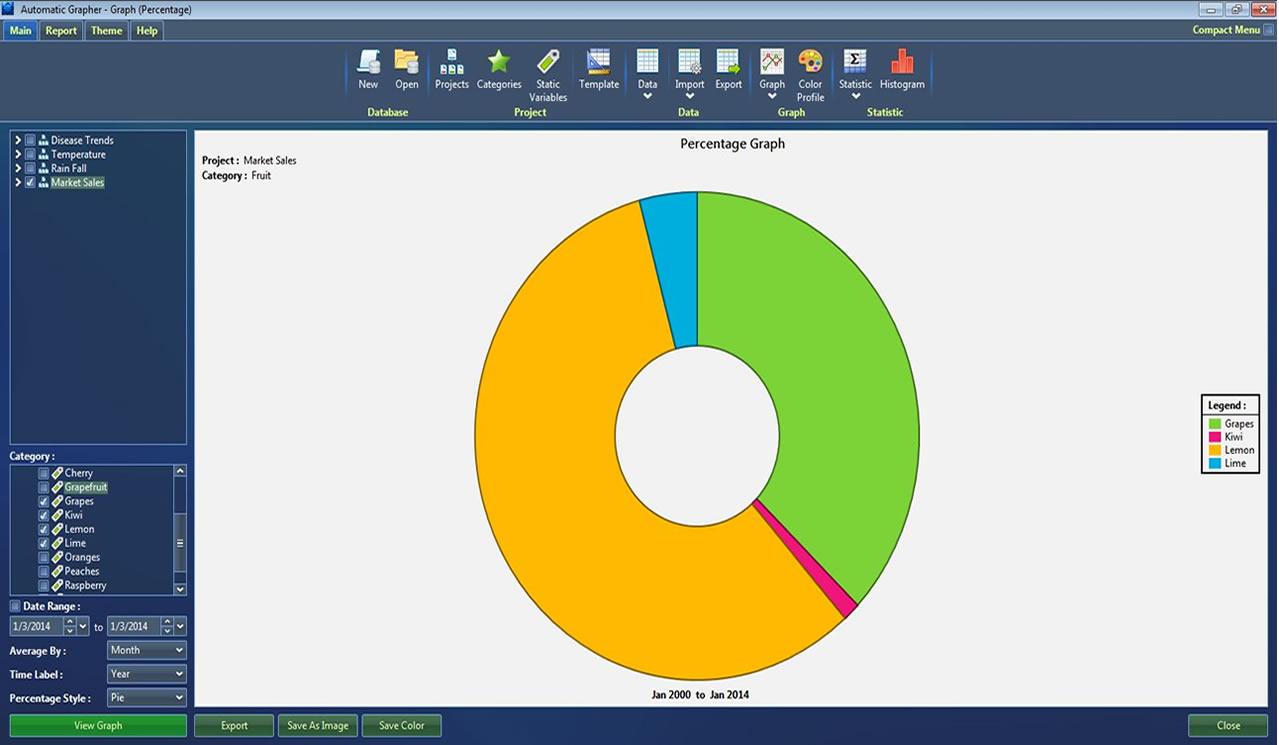
Pie Chart
- Plot group data using a pie chart.
- Graph averages by month, day and year.
- Easily add new items to add to graph.
- Graph specific dates.
- Average data by date, month or year.
- Fully customizable color options.
- Export plot for presentations and reports.
- Export data and graphs into an Excel file.